Lab 1 - Figure 2-13
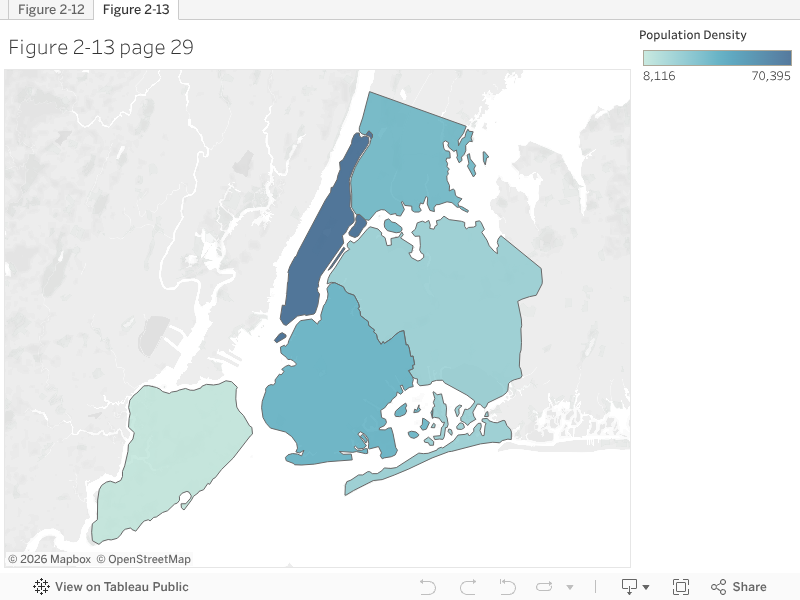
Lab 1 Figure 2-13 - Map of New York's Burroughs Population Density
This is the second part of lab 1, figure 2-13 from our textbook. In this excersie, we create a map of New York's Burroughs Population Density. To achieve this, we calculated the Population Density field by dividing the "Population" measure by the "Area sq-mi" measure. Then, we used the "Show me" feature after control clicking on the "Population Density" calculated measure field and the "County" Dimension Click on the map elements to see the underlying data! - Ryan Facks zID 2027325


Comments
Post a Comment