United States Presidents Lifespan and Time in Office Timeline (Lab 4 Task 3)
United States Presidents Lifespan and Time in Office Timeline (Lab 4 Task 3)
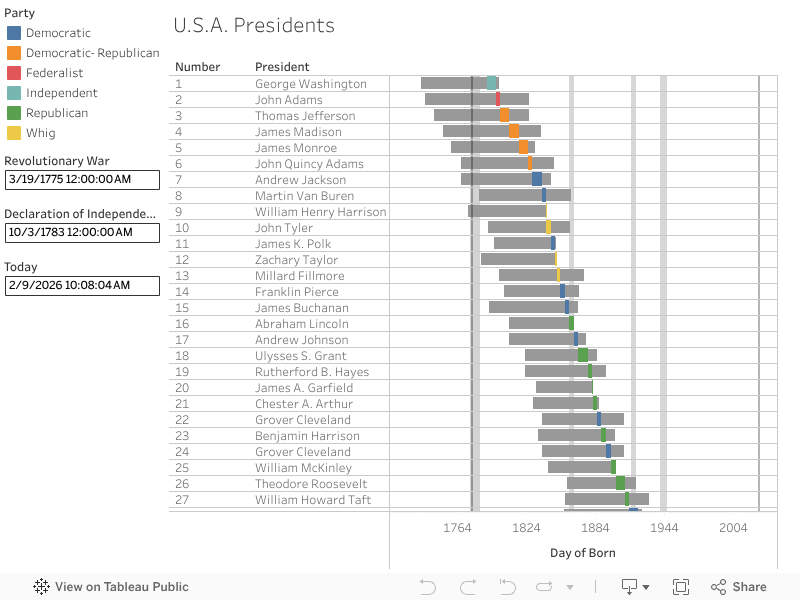
For lab 4 task 3, we created a timeline of U.S.A. presidents, their lifespan, and their time in office. We had to begin this project with some slight data entry to update the presidents excel sheet to include Donald Trump and Joe Biden. Additionally, we had to unfortunately mark the passing of Jimmy Carter and George H. W. Bush. This timeline chart also has some reference lines and bands representing major time periods for America such as the Declaration of Independence and major wars fought. A slight trend that I notice immediately is that the lifespan of presidents has gradually increased as we approached the 21st century. This could be attributed to the fact that modern medicine allows humans to generally live long and the average life span has increased in a developed country such as the U.S.A. Ryan Facks - zID 2027325
Discussion of Lab 4 - Comparison Between Dual-Axis Line Chart, Connected Scatterplot, and Timeline chart - Pros and Cons
Dual-Axis Line Chart
For the Dual-Axis Line Chart, we can see that the chart is far more efficient when it comes to space without the need to have two separate graphs for each axis. However, the Dual-Axis line chart can cause some confusion if the axises are vauge and If the lines cross over themselves repeatedly, it could be confusing for the audience to decipher what a specific lines actual value is at a given point.
Connected Scatter Plot
With the connected scatterplot, we can see that how the relationship between two axises change overtime and see the interaction between datapoints. This type of chart appears good at showing shifts or "back and forth" areas where data is adjusting to a new "normal." However, the chart could be difficult for some audiences to read because time does not necessairly appear linear on the x-axis. I know for me personally, in our MLB scatterplot excersise, I had difficulty following the years as the trend line went from left to right. Additionally, if I did not explicitly show the time on each dot, I would have no clue what each data point is representing in terms of time.
Timeline Area Chart
The timeline area chart that we used works well for U.S.A. presidents excersise that we did, however, I feel like as the list of presidents grows, the chart will become more and more difficult to read. The timeline will also be a large factor in visual clarity as when it grows, the chart will become more and more squished together and more difficult to read.
Which one is the best?
The answer to this question is "It depends." When creating a geovisualization product, one must always keep in mind their audicence as well as how rich or poor their data is before beginning work. As GIS professionals, it is our job as the communicator to choose the chart that provides the most visual clarity and communicates the message clearly without sacrificing data accuracy. In my mind, I see the line charts as answering more of the "what" while the connected scatterplot explains the "how" and the timeline chart showing "when?" As with all phenomna, it may be suitable to have multiple charts and multiple studies in order to communicate the most holistic view of a study.


Comments
Post a Comment